Beyond 40 Gbps: Processing OPRA in real-time
Renan Gemignani, Director of Engineering at Databento, opened Quant Night London with a deep dive into how we scale real-time OPRA options data, handling over 200 billion regional quotes and NBBO updates per day across 96 inbound channels. The event was co-hosted by Databento, Man Group, Thalesians, and ArcticDB on June 17, 2025.
You can watch the full video on YouTube and use the index below to navigate to any section of the transcript, which has been edited for clarity and brevity. Each section heading includes a timestamp that links directly to that point in the recording.
- 0:25 – What is Databento?
- 1:30 – What is OPRA?
- 2:16 – The problem: Size of OPRA
- 3:33 – OPRA bursts
- 4:29 – OPRA message rate trend
- 5:25 – Achieving lossless capture
- 8:50 – Channel sharding
- 10:06 – Pre and post rebalancing
- 11:14 – Serving gapless live data
- 12:33 – Reducing I/O, processing NBBO
- 13:51 – Avoid blocking the critical path
- 16:08 – Databento coverage
Good evening, everyone. Thanks for joining. My name is Renan Gemignani, and I’m Director of Engineering at Databento. Today, I’m here to talk about OPRA and the technical challenges associated with onboarding this feed and distributing it to our customers.
First up: who are we, and why do we care about OPRA?
Databento is a market data provider. Our team is composed of people from across the financial industry—prop shops, market makers, asset managers, you name it. And the one thing we all have in common is that we were all involved, at some point, in the process of market data acquisition and onboarding. We ran into a lot of difficulty, so we wanted to do better by addressing two big pain points: (1) finding high-quality data and (2) onboarding it into trading applications.
We capture and distribute data directly from our colocation sites. We are currently distributing data for more than 70 venues, including the entire U.S. equity options market via the OPRA feed, which we've been capturing since 2023.
Now, for a bit of background, since we’re not in the U.S.: What is OPRA?
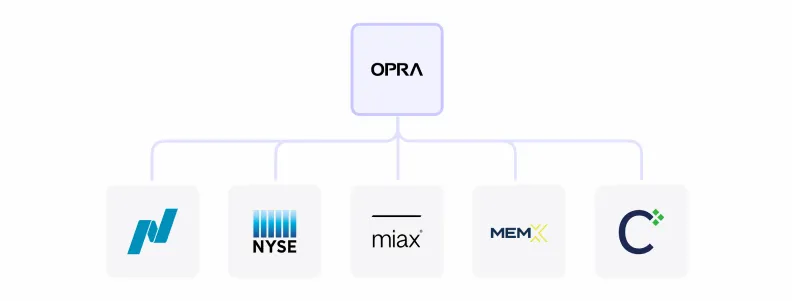
OPRA (Options Price Reporting Authority) is the Securities Information Processor (SIP) for U.S. equity options—analogous to the CTA and UTP SIPs for U.S. equities. The options market is composed of 18 different exchanges, some owned by Nasdaq, some by NYSE, some by Cboe, etc. OPRA consolidates data from all of these exchanges and publishes top-of-book quotes and trades. In addition, OPRA calculates and publishes the national BBO (NBBO), which is the best bid and best ask across the entire market.
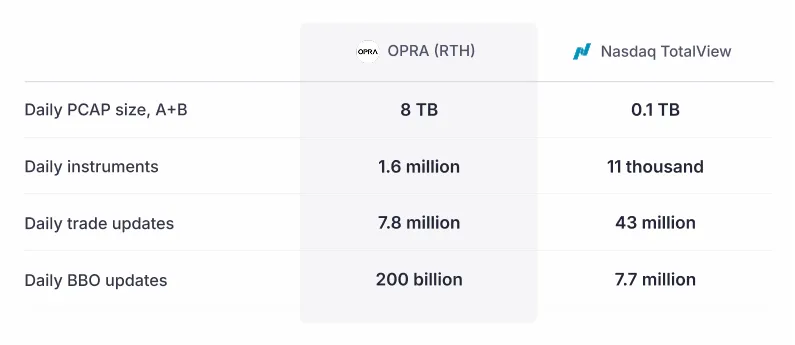
When onboarding this feed, the first thing you notice is that it’s big—very big, even enormous. For a point of comparison, take Nasdaq TotalView, a market-by-order (MBO) feed. Usually, when you compare a top-of-book feed and an MBO feed from the same exchange, the MBO tends to have a lot more data. Yet the daily PCAP size we get from OPRA (top-of-book) is about 80x what we see for Nasdaq (MBO).
The number of instruments we have to handle is in the millions, compared with roughly 10,000–20,000 for U.S. equities. And while the total number of trades in the whole market isn't that large, the number of BBO updates completely dwarfs every other feed we’ve onboarded so far, reaching into the hundreds of billions per day.
Storing all that data is a challenge in itself, so we need a pretty big storage cluster, but today I want to focus on another challenge: capturing this feed at the rate that OPRA sends it.
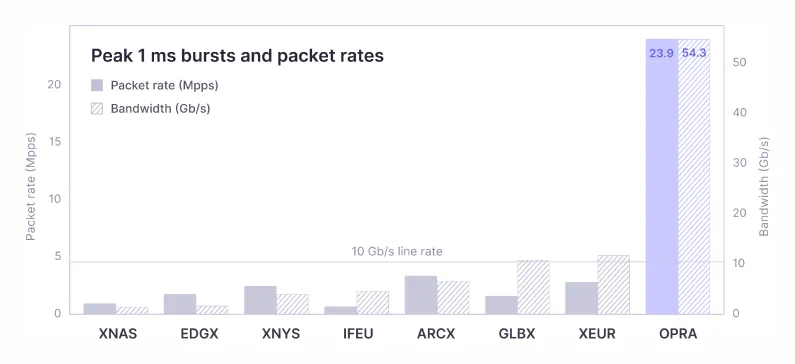
OPRA isn't only big—it's also bursty.
What do I mean by that? Beyond the sustained rate of publishing data from OPRA, there are brief intervals—often immediately after a trade on the underlying—where the feed explodes with activity within just 1–10 milliseconds. During these microbursts, the packet rate can spike significantly.
As you can see, this slide shows a comparison across several other venues we offer. For most of them, you can handle microbursts with a 10-gig line (10 Gbps). With OPRA, that's absolutely not feasible because the peak bursts can exceed 50 Gbps, which means that if you're on a 10 Gbps line, you're going to drop packets because the data doesn't fit in the pipes.
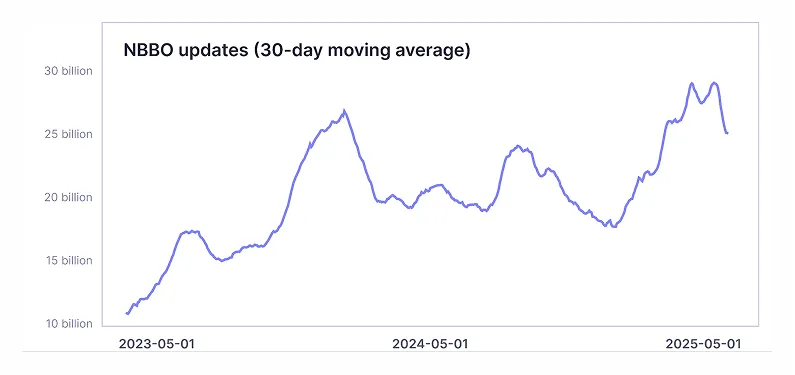
So, it's big, it's bursty, and—even worse—it keeps getting bigger. This is the number of NBBO updates that we've had per day since we started capturing OPRA back in 2023. There are bigger and smaller days, but the trend is upward, and each large peak tends to be higher than the previous ones. The last major peak was around April 2, 2025, when the White House announced sweeping import tariffs.
We expect this upward trend to continue, so as a data provider, we need to be prepared to handle the feed as it is today and be ready for the next peak event. By sheer volume, OPRA has been the most difficult feed we've onboarded so far.
This colors our choices through the whole stack, starting with the hardware. Here's the network card that we use on both our capture hosts and our live data hosts: a Napatech 100G (NT200A02).
There are a few things we like about this card:
Big buffers are important when capturing data because, during those microbursts, you’re probably not going to be able to handle packets at the rate the exchange is sending them, so you need somewhere to stash them—and that goes into the network card buffer. The larger the buffer, the more you can withstand these microbursts.
Because it’s FPGA-based, we can flexibly assign buffers to different feeds. That’s important for us because we don’t just capture OPRA on our capture hosts in NY4. We also capture the proprietary feeds from nearly every U.S. equities venue, so we can’t dedicate our entire buffers to OPRA.
When we’re reading packets, we can directly access the buffer on the network card, avoiding a round trip through the kernel each time we want to receive more data. Going into kernel mode is generally bad; it trashes your instruction cache and interrupts the application. When you're getting a burst of data, you need your application to be constantly processing packets as quickly as possible. We compile a custom version of tcpdump that leverages the user-space SDK to be more performant when capturing the packets.
The size of the feed and the bursts basically force us to use NVMe flash drives. Our PCAP storage cluster is mostly made up of spinning hard drives, but you can’t capture OPRA directly onto those drives. We capture the data on NVMe drives first, then ship it off to the spinning cluster. (Our storage engineers could probably give a whole talk on the spinning cluster alone.)
While we’re talking about hardware, kernel tuning, core isolation, NUMA-node isolation, and core pinning are all instrumental to ensure the applications dedicated to capture—all those tcpdump processes—run uninterrupted and can keep pumping out more data. It's pretty much a necessity, and you can't get away without this kind of tuning if you want to achieve lossless capture.
Now, this doesn’t mean you can just take the nice hardware, dump the feed into it, and expect everything to work—we tried that, and it doesn’t. So we had to get a little bit creative.
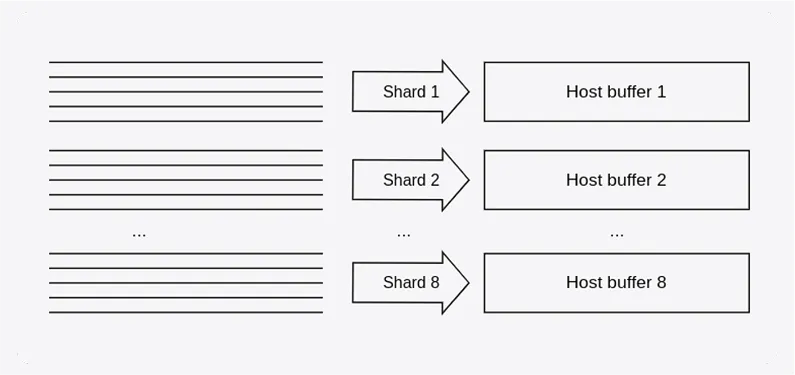
One thing we do is increase the parallelization of our capture by sharding the feed into multiple blocks. OPRA isn’t one giant line; it’s actually 96 separate channels, and the options are distributed across those channels. Each channel is relatively independent from the others, so we can process them in parallel:
- Take all 96 channels and group them into eight shards of 12 channels each.
- Assign a 4 GB host buffer in the network card to each shard.
Now, one interesting thing about this channel division is that, although OPRA does its best to balance the volume across channels, the distribution isn't actually very even.
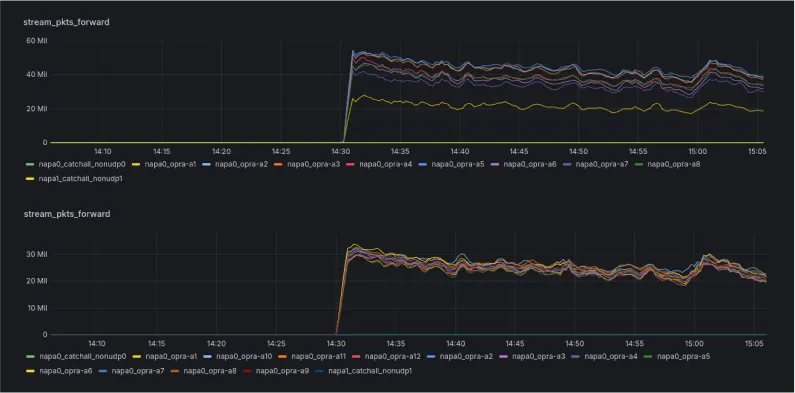
If you randomly toss eight channels into any shard, you can end up with a situation like what you see in the top chart: one shard gets a much higher packet rate than another. When a burst arrives, the larger shard may drop packets while the other shard sits idle, doing what it normally does (not that much).
So we regularly rebalance our shards. We take a look at the packet rate for each channel and strive to group them so that (1) the final data size is roughly even, and (2) bursts within the same shard aren't correlated. If every channel in a shard bursts at the same time, you risk dropping packets.
To avoid this, we continually reanalyze the packet rates and redistribute channels to achieve a balanced result—similar to the bottom chart—where all shards perform roughly the same amount of work.

Capture and live data workflows.
Now, that's it for our capture, but we don't provide only historical data. We're also distributing this data to our customers in real time. Real-time data introduces a few additional challenges.
First, you're no longer just saving packets to disk. When distributing live data, we need to:
- Receive the exchange feeds
- Deduplicate the packets
- Parse the exchange protocol
- Normalize this into our internal protocol
- And then send it to our clients and save some of it to disk
This is quite a bit more work than just basic I/O.
Everything I mentioned earlier still applies here. We use the same network cards, the same sharding approach, core isolation, and NUMA-node alignment. But with real-time data, latency becomes a concern.
Customers have latency expectations, so it's not enough to just take a giant buffer, stash the packets there, and hope for the best.
Now, one way to improve performance is simply to process less data. As programmers like to say, the fastest code is the code that doesn’t have to run.
We distribute this feed over the internet for some of our customers, which means we need to be bandwidth-conscious of the data we send. Many of these customers are only interested in the NBBO—the consolidated top-of-book view of the market.
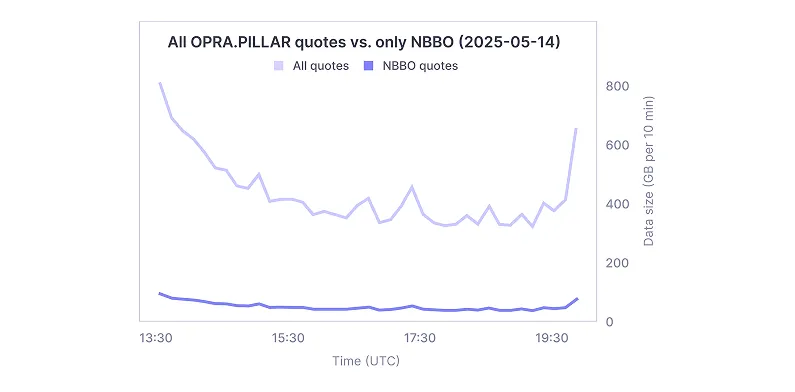
As I mentioned earlier, OPRA consolidates and publishes top-of-book data across all venues. Most exchange updates don't actually change the NBBO, so we can ignore around 80% of the data. We receive it on the NIC and immediately drop it as soon as we detect that it's not an update to the NBBO.
In the chart here, we’re comparing all exchange updates to just the NBBO updates. The difference is significant, and it’s largest during peak activity—right after the open and just before the close, when the most data is flowing through.

Impact of out-of-band computation.
The other thing we can do, aside from processing less data to begin with, is to avoid blocking the critical path. As I mentioned earlier, we want our applications to process data uninterrupted, and this is even more true for live data.
At Databento, we provide not only top-of-book trades data, but also subsampled data: 1-second, 1-minute, 1-hour, and daily bars, as well as BBO subsampled at fixed intervals. This is especially important for clients receiving data over the internet, as they often lack the bandwidth to take in the full feed with every quote. Instead, they may choose to stream data using a subsampled schema like CBBO-1s, which sends one update per second.
Generating this schema in real time presents its own challenges. If you try to build it in the critical path while processing the feed and accumulating the bars, then once per second—for each of the 1.6 million OPRA instruments—you have to stop and publish the subsampled BBOs and bars for that interval. If that happens on the critical path, you introduce stalls that can last a few milliseconds, and that’s just enough time to start dropping packets.
So far, OPRA has been the only venue where we’ve needed to handle this differently. For all our other venues, we can receive data at the exchange’s line rate and compute the subsampled schemas in band. But with OPRA, that approach doesn’t work.
In the graph above, the pink line shows our initial attempt, where we computed the subsampled data in band. The blue line shows the improvement after moving that computation out of band. Not only is latency uniformly better, but the spikes are also less frequent and less intense.
The bottom line is that your critical loop—receiving packets, normalizing, and publishing—needs to be as lean as possible to minimize the risk of a microburst disrupting it.
Thank you for attending! If you're interested in options data at Databento, we offer plans suitable for both small teams and large enterprises.
We distribute live data over the intefrnet through our APIs, via cloud handoffs (site-to-site connections to public cloud), and through other dedicated connectivity options, including site-to-site connections to physical PoPs and cross-connects within data centers.
We have historical data starting from 2013, and we have OPRA PCAP files dating back to 2023. You can explore all of our data on our website.
Answer: We actually have a split. Our feed handlers are written in C++, and our distribution gateway—the thing clients connect to—is in Rust. The two halves communicate through shared memory, and there are very good reasons for choosing each language for each part.
Rust really shines with lifetimes and concurrency, and it lets us do that safely, especially on an endpoint that’s accessible by clients who might inadvertently trigger issues like buffer overflows. Because this is a publicly accessible API, we want that side to be as safe as possible. The Rust async framework also helps us deal with slow clients because we use TCP for the transport.
On the feed handler side, we use C++ mostly because you don’t have the allocation safety problem; you allocate a giant slab of memory and work within it, so lifetime considerations aren’t as important. Also, the critical loop does the least possible amount of thread interchange for all the reasons I mentioned earlier.
So, we use a little bit of C++ and a little bit of Rust.
Answer: For our feed handlers, we currently have both the “top half” and the “bottom half” running on the same host, and they communicate through a shared-memory queue. That’s basically as good as you can get for interprocess-communication latency.
Of course, there are trade-offs. We’re considering moving some client load off the same box as the feed handler to handle more clients, but that comes at a latency cost. You’re always balancing scalability and latency. In high-frequency trading, you often optimize for lower latency, and if something needs to get dropped, it will.
Answer: That figure is already compressed with Zstandard (zstd).
Follow-up: Great—so you have very nice hardware suppliers.
Answer: Oh yeah. Our procurement team is busy because we’re constantly buying more. Luca likes to post those hardware photos on LinkedIn. Every now and then, we have to onboard new racks with more drives. It’s a job.
Answer: That's what I mentioned about the user-space SDK. We’re not reverse-engineering the NIC. They have their own kernel bypass API, and we use that. It basically handles all DMA, so we're consumers of the NIC vendor’s API.
Follow-up: Do you ever have issues with TCP storms?
Answer: Our ingress is all UDP multicast, so TCP isn’t involved on that side. For example, on our capture hosts, it’s ingress-only. For live data, ingress is UDP multicast and egress is TCP, but we use a different NIC for egress. We don’t want the NIC handling the incoming firehose from the exchange to also handle the data we send to clients. So, we separate them and have two NICs on every live data host.
Answer: We publish this on our website. You can check our latency page for internal feed latency and end-to-end latency to major data centers over the public internet, broken out by dataset and client location. We also provide tutorials on estimating Databento feed latency.
End-to-end latency is hard to state as a single number because it depends on where you’re getting the data from and the speed at which the client consumes the data. For example, latencies will differ if you’re getting the data over the public internet versus via direct connectivity on a cross-connect at NY2 or NY4.