Downsampling pricing data into bars using Python, Rust, and Polars: Part 2

This article was written by our customer, Nelson Griffiths, Engineering and Machine Learning Lead at Double River Investments, a quantitative investment manager focusing on global equity markets, utilizing fundamental, technical, and alternative data. Nelson follows up on part one of his guest post series, downsampling pricing data into bars, introducing two new bar aggregations with volume and dollar bars.
In part 1, we generated standard time bars and tick bars from the DBEQ.BASIC dataset from Databento. We compared tick bars to time bars and looked at some of their nice statistical properties.
In part 2, we will look at two more types of bar aggregations we can do with tick data to get different types of information. Specifically, we are going to dive into volume bars and dollar bars. In this section, we will focus on how to compute these types of bars efficiently. We will walk through a naive Python implementation of the computation before looking at improving our speed writing code in Rust and integrating that code with Polars.
Let’s focus on volume bars for the time being. In Marcos Lopez de Prado’s book Advances in Financial Machine Learning, he says, “One problem with tick bars is that order fragmentation introduces some arbitrariness in the number of ticks… Volume bars circumvent the problem by sampling every time a pre-defined amount of the security’s units have been exchanged.” So, to create volume bars, we are going to create a bar every time n shares are exchanged. This provides us value over the tick bars because it will lead to a distribution that is closer to an IID Gaussian distribution. This also introduces a problem that DataFrames are not very adept at solving.
We need to sample in a way that we will have to have bar cutoffs in the middle of ticks. For example, if we want to sample a bar every 100 shares, and we have 3 ticks that look like this:
ts_event    price    size
       0      5.0      70
       1      8.0      50
       2     10.0      80
We will end up with 2 volume bars, each with a size of 100. Our first bar will be made up of all of the first tick and 30 shares of the second tick. We can calculate then the vwap of that bar by doing a calculation that looks like this:
(5.0 * 70) + (8.0 * 30) / 100
For our second volume bar, we then take the remaining 20 shares of the second tick and the 80 shares from the third tick to form a second volume bar that also represents 100 shares being exchanged in the market. Our final bars will look something like this:
bar    vwap    size
  0     5.9     100
  1     9.6     100
Let’s start by testing a simple Python function that can calculate the volume bars for us from a DataFrame.
def volume_bars_py(df: pl.DataFrame, bar_size) -> pl.DataFrame:

    def _to_ohlcv_df(bar_rows: list[tuple]):
        return pl.DataFrame(
            bar_rows, schema=["symbol", "ts_event", "price", "size"]
        ).select(
            pl.col("symbol").first(),
            pl.col("ts_event").first().alias("start_dt"),
            pl.col("ts_event").last().alias("end_dt"),
            pl.col("price").first().alias("open"),
            pl.col("price").max().alias("high"),
            pl.col("price").min().alias("low"),
            pl.col("price").last().alias("close"),
            ((pl.col("price") * pl.col("size")).sum() / pl.col("size").sum()).alias(
                "vwap"
            ),
            pl.col("size").sum().alias("volume"),
            pl.len().alias("n_transactions"),
        )

    ohlcv_rows = []
    current_bar = []
    for row in df.rows(named=True):
        remaining_size = bar_size - sum([r[-1] for r in current_bar])
        while row["size"] > remaining_size:
            current_bar.append(
                (row["symbol"], row["ts_event"], row["price"], remaining_size)
            )
            ohlcv_rows.append(_to_ohlcv_df(current_bar))
            current_bar = []
            row["size"] = row["size"] - remaining_size
            remaining_size = bar_size

        if row["size"] > 0:
            current_bar.append(
                (row["symbol"], row["ts_event"], row["price"], row["size"])
            )
    return pl.concat(ohlcv_rows)
In the code above, we loop through each row in the DataFrame, creating n-sized bars from as many rows as needed. After creating each row, we store a Polars DataFrame containing the information for that bar. This works, and it gives the right answer. But it is not fast. Anytime you have to loop through a DataFrame, that is a big red flag for me. So, how can we speed it up? The answer is that we need to leave Python land for a second and head into Rust land. Luckily, Polars makes this as easy as possible with plugins.
On a high level, Polars allows you to write your own expressions in Rust that plug into its compute engine. This is a huge advantage for Polars users. These functionalities that are so difficult to implement in a DataFrame can still be written fast. On top of that, you can take advantage of Polars ability to execute in parallel to run all of your super-fast Rust code! We will not have to do anything in our code to ensure the parallel execution of our functions. Polars’ engine will automatically parallelize our calculations over groups when we use a group_by or over entry point.
We are going to walk through a Rust implementation of this same function and then compare it to our Python function. I will not show all the pieces here that you need to make a Polars plugin go, but if you are interested in learning more, check out this excellent tutorial.
Let’s start simply with a native Rust implementation of a struct to calculate our OHLCV for us.
/// Struct representing a collection of transactions.
struct BarTransactions {
    transactions: Vec<Transaction>,
}

impl BarTransactions {
    /// Create a new instance of BarTransactions.
    fn new() -> Self {
        Self {
            transactions: Vec::new(),
        }
    }

    /// Add a new transaction to the collection.
    fn add_transaction(&mut self, price: f64, size: u32, dt: i64) {
        self.transactions.push(Transaction { price, size, dt });
    }

    /// Check if the collection is empty.
    fn is_empty(&self) -> bool {
        self.transactions.is_empty()
    }

    /// Clear all transactions from the collection.
    fn clear_transactions(&mut self) {
        self.transactions.clear();
    }

    /// Get the current volume of the transactions.
    fn get_current_volume(&self) -> u32 {
        self.transactions.iter().map(|t| t.size).sum()
    }

    /// Get the current dollar volume of the transactions.
    fn get_current_dollar_volume(&self) -> f64 {
        self.transactions
            .iter()
            .map(|t| t.price * t.size as f64)
            .sum()
    }

    /// Calculate the OHLCV data from the transactions.
    fn calculate_ohlcv(&self) -> OHLCV {
        let start_dt = self.transactions.first().unwrap().dt;
        let end_dt = self.transactions.last().unwrap().dt;
        let open = self.transactions.first().unwrap().price;
        let close = self.transactions.last().unwrap().price;
        let high = self
            .transactions
            .iter()
            .map(|t| t.price)
            .fold(f64::MIN, f64::max);
        let low = self
            .transactions
            .iter()
            .map(|t| t.price)
            .fold(f64::MAX, f64::min);
        let volume = self.transactions.iter().map(|t| t.size).sum::<u32>();
        let vwap = self
            .transactions
            .iter()
            .map(|t| t.price * t.size as f64)
            .sum::<f64>()
            / volume as f64;
        let n_transactions = self.transactions.len().try_into().unwrap();
        OHLCV {
            start_dt,
            end_dt,
            open,
            high,
            low,
            close,
            vwap,
            volume,
            n_transactions,
        }
    }
}
Now, we have an object that will collect our transactions and create a bar for us. Next, let’s look at the function that will iterate through our transactions and create the bars for us.
fn calculate_bars_from_trades(
    datetimes: &[Option<i64>],       // Datetimes of the trades
    prices: &[Option<f64>],          // Prices of the trades
    sizes: &[Option<u32>],           // Sizes of the trades
    threshold: &[u32], // Threshold for calculating the bars
) -> PolarsResult<DataFrame> {
    // TODO: Add dollar volume to OHLCV
    let mut bars: Vec<OHLCV> = Vec::new(); // Vector to store the calculated bars
    let mut start_dt: Vec<i64> = Vec::new(); // Vector to store the start datetimes of the bars
    let mut end_dt: Vec<i64> = Vec::new(); // Vector to store the end datetimes of the bars
    let mut opens: Vec<f64> = Vec::new(); // Vector to store the opening prices of the bars
    let mut highs: Vec<f64> = Vec::new(); // Vector to store the highest prices of the bars
    let mut lows: Vec<f64> = Vec::new(); // Vector to store the lowest prices of the bars
    let mut closes: Vec<f64> = Vec::new(); // Vector to store the closing prices of the bars
    let mut vwap: Vec<f64> = Vec::new(); // Vector to store the volume weighted average prices of the bars
    let mut volumes: Vec<u32> = Vec::new(); // Vector to store the volumes of the bars
    let mut n_transactions: Vec<u32> = Vec::new(); // Vector to store the number of transactions in the bars
    let mut bar_transactions = BarTransactions::new(); // BarTransactions instance to calculate the bars

    // CALCULATE BARS AND ADD TO SERIES THEN CREATE DF
    for (((dt, price), size), thresh) in datetimes
        .iter()
        .zip(prices.iter())
        .zip(sizes.iter())
        .zip(threshold.iter())
    {
        if let (Some(dt), Some(price), Some(mut size), Some(thresh)) = (dt, price, size, thresh) {
            if size >= thresh - bar_transactions.get_current_volume() {
                let mut remaining_size = thresh - bar_transactions.get_current_volume();
                while size >= remaining_size {
                    bar_transactions.add_transaction(*price, remaining_size, *dt);
                    let ohlcv = bar_transactions.calculate_ohlcv();
                    start_dt.push(ohlcv.start_dt);
                    end_dt.push(ohlcv.end_dt);
                    opens.push(ohlcv.open);
                    highs.push(ohlcv.high);
                    lows.push(ohlcv.low);
                    closes.push(ohlcv.close);
                    vwap.push(ohlcv.vwap);
                    volumes.push(ohlcv.volume);
                    n_transactions.push(ohlcv.n_transactions);
                    bars.push(ohlcv);
                    bar_transactions.clear_transactions();
                    size -= remaining_size;
                    remaining_size = *thresh;
                }
                if size > 0 {
                    bar_transactions.add_transaction(*price, size, *dt);
                }
            } else {
                bar_transactions.add_transaction(*price, size, *dt);
            }
    }
    if !bar_transactions.is_empty() {
        let ohlcv = bar_transactions.calculate_ohlcv();
        start_dt.push(ohlcv.start_dt);
        end_dt.push(ohlcv.end_dt);
        opens.push(ohlcv.open);
        highs.push(ohlcv.high);
        lows.push(ohlcv.low);
        closes.push(ohlcv.close);
        vwap.push(ohlcv.vwap);
        volumes.push(ohlcv.volume);
        n_transactions.push(ohlcv.n_transactions);
        bars.push(ohlcv);
    }
    df!(
        "start_dt" => Series::from_vec("start_dt", start_dt),
        "end_dt" => Series::from_vec("end_dt", end_dt),
        "open" => Series::from_vec("open", opens),
        "high" => Series::from_vec("high", highs),
        "low" => Series::from_vec("low", lows),
        "close" => Series::from_vec("close", closes),
        "vwap" => Series::from_vec("vwap", vwap),
        "volume" => Series::from_vec("volume", volumes),
        "n_transactions" => Series::from_vec("n_transactions", n_transactions)
There is a lot more code here than in the Python version, but we are essentially doing the same thing. Iterate over all the transactions, append them to our BarTransactions object until we hit our threshold, create a bar, and do it again.
Then we can throw in a function to tie this all back into Polars:
#[polars_expr(output_type_func=ohlcv_struct_type)] // FIXME
pub fn volume_bars(inputs: &[Series]) -> PolarsResult<Series> {
    let dts = inputs[0].datetime()?; // Datetimes of the trades
    let dt_type = dts.dtype(); // Type of the datetimes
    let dts = dts.to_vec(); // Convert the datetimes to a vector
    let prices = inputs[1].f64()?.to_vec(); // Prices of the trades
    let sizes = inputs[2].u32()?.to_vec(); // Sizes of the trades
    let threshold = inputs[3].u32()?.to_vec(); // Threshold for calculating the bars

    // Calculate the bars from the trades
    let bars = calculate_bars_from_trades(
        dts.as_slice(),
        prices.as_slice(),
        sizes.as_slice(),
        threshold.as_slice(),
    )?;
    let s = bars
        .lazy()
        .with_columns(vec![
            col("start_dt").cast(dt_type.clone()), // Cast the start datetimes to the original type
            col("end_dt").cast(dt_type.clone()),   // Cast the end datetimes to the original type
        ])
        .select([as_struct(vec![
            col("start_dt"),
            col("end_dt"),
            col("open"),
            col("high"),
            col("low"),
            col("close"),
            col("vwap"),
            col("volume"),
            col("n_transactions"),
        ])
        .alias("bar")])
        .collect()?
        .column("bar")?
        .clone(); // Select the OHLCV struct and cast it to the original type
    Ok(s) // Return the calculated bars
}
And finally, we expose it in Python:
def volume_bars(
    df: FrameType,
    timestamp_col: str = "ts_event",
    price_col: str = "price",
    size_col: str = "size",
    symbol_col: str = "symbol",
    bar_size: float | pl.Expr = 1_000_000,
) -> FrameType:
    """
    Generate volume bars for a given DataFrame.

    The function takes a DataFrame, a timestamp column, a price column, a size column,
        a symbol column, and a bar size as input.
    The bar size is the total volume that will be aggregated into a single bar.

    Args:
    ----
        df (FrameType): The DataFrame/LazyFrame to generate volume bars for.
        timestamp_col (str): The name of the timestamp column in the DataFrame.
        price_col (str): The name of the price column in the DataFrame.
        size_col (str): The name of the size column in the DataFrame.
        symbol_col (str): The name of the symbol column in the DataFrame.
        bar_size (int | float | dict[str, int | float] | pl.Expr): The total volume to
             aggregate into a single bar.

    Returns:
    -------
        FrameType: A DataFrame with volume bars.

    """
    df = df.sort(timestamp_col)
    if isinstance(bar_size, int | float):
        df = df.with_columns(pl.lit(bar_size).cast(pl.UInt32).alias("__PFIN_bar_size"))
    elif isinstance(bar_size, pl.Expr):
        df = df.with_columns(bar_size.cast(pl.UInt32).alias("__PFIN_bar_size"))
    else:
        msg = "bar_size must be an int, float, or pl.Expr"
        raise TypeError(msg)

    return (
        df.group_by(symbol_col, pl.col(timestamp_col).dt.date())
        .agg(
            register_plugin_function(
                plugin_path=Path(__file__).parent,
                function_name="volume_bars",
                is_elementwise=False,
                cast_to_supertype=False,
                args=[pl.col(timestamp_col), pl.col(price_col), pl.col(size_col), pl.col("__PFIN_bar_size")],
                changes_length=True,
            )
        )
        .explode("ohlcv")
        .unnest("ohlcv")
        .drop(timestamp_col)
    )
Okay, that was a lot of code. Was it worth it? Let’s run some speed tests and see.
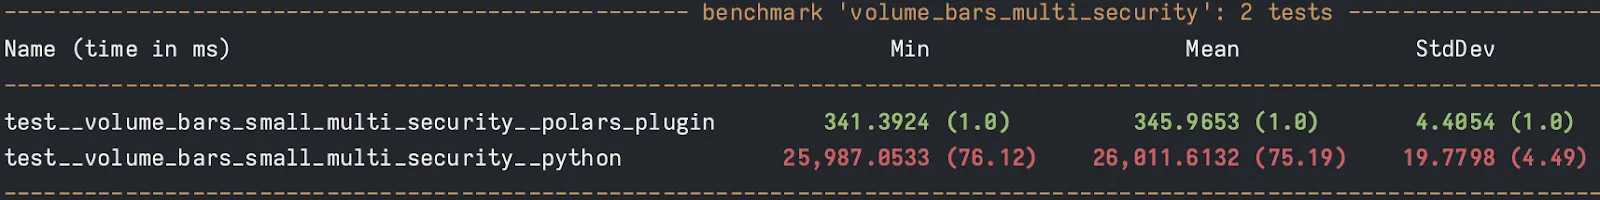
It looks like our Polars plugin is by about 75x! Disclaimer: I am not a top-level Rust engineer. I am sure this could get even faster. But now we have something that runs in a reasonable amount of time and can give us the bar samplings that we want.
For the sake of not looking at a few hundred more lines of code, I am going to skip reviewing the implementation of pricing bars. If you want to see a more complete version of all this code, check out my GitHub repository.
We will talk about dollar bars though. Dollar bars look at sampling in a similar was as volume bars. The difference being that instead of sampling every n shares, we will sample every n dollars that are exchanged. This provides a more uniform sampling over time periods for two reasons.
- Dollar bars are robust to large price changes over time.
- Dollar bars are robust to changes in the number of outstanding shares that impact volume and tick bars.
Now, let’s compare the 4 types of bars that we have generated over these 2 articles. For this analysis, we are going to look at Apple stock over the past year from Databento’s XNAS.ITCH dataset. To pull this data, you can use the following code:
import polars as pl
import databento as db
import datetime as dt

start_time = dt.datetime(2023, 3, 12, 9, 30, 0, 0, pytz.timezone("US/Eastern"))
end_time = dt.datetime(2024, 3, 12, 16, 0, 0, 0, pytz.timezone("US/Eastern"))

client = db.Historical()  # Either pass your API key here or set your ENV variable.
dbn = client.timeseries.get_range(
    "XNAS.ITCH",
    start_time,
    end_time,
    symbols=["AAPL"],
    schema="trades"
)  # This will cost charge your account.

# Make the dataframe lazy for future ops
df = pl.from_pandas(dbn.to_df().reset_index()).lazy()
We are going to compute all of our bar types for this single stock. A quick show of compute time for 1 year (~27 million rows) of data for each bar type:
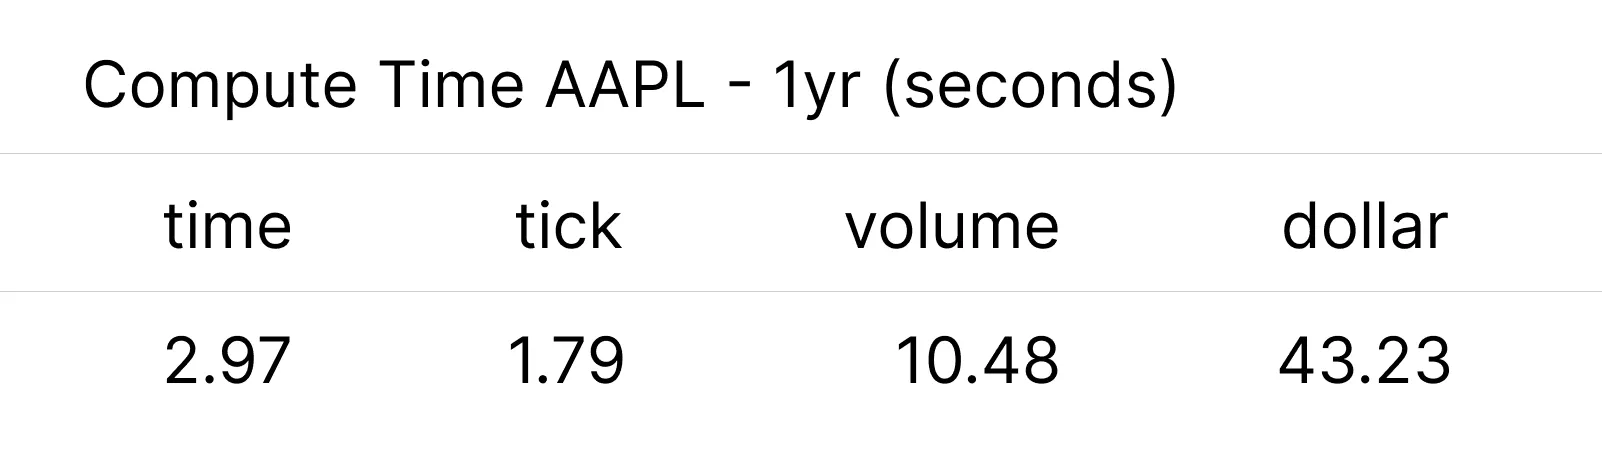
This means that for a single security, computing the volume bar over a year with pure Python would have likely taken something like 13 minutes to complete.
We will look at 2 different ideas to compare these bars. First, we will look at the number of bars per day over time for the tick, volume, and dollar bars. For this comparison, we will sample bars such that each bar type has an average count of 50 bars per day over the entire year.
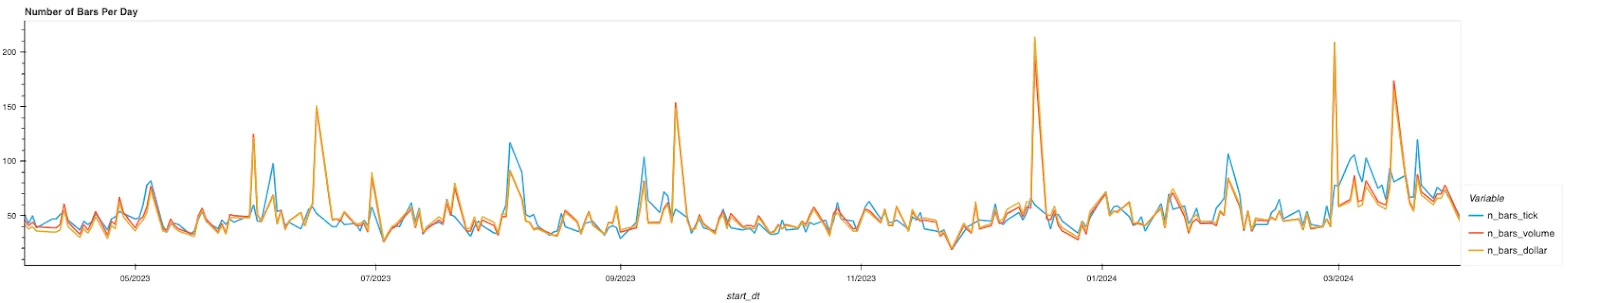
From this, we can see that over the past year, there have been multiple days with large spikes on the dollar bars and volume bars that don’t happen with the tick bars. Days where it would be beneficial to capture bars like this because more security was traded in a normal number of transactions. The volume and dollar bars, as expected, roughly track together over the entire period. We expect these over short periods of time to look largely similar. However, they both potentially provide more desirable information than tick and time bars.
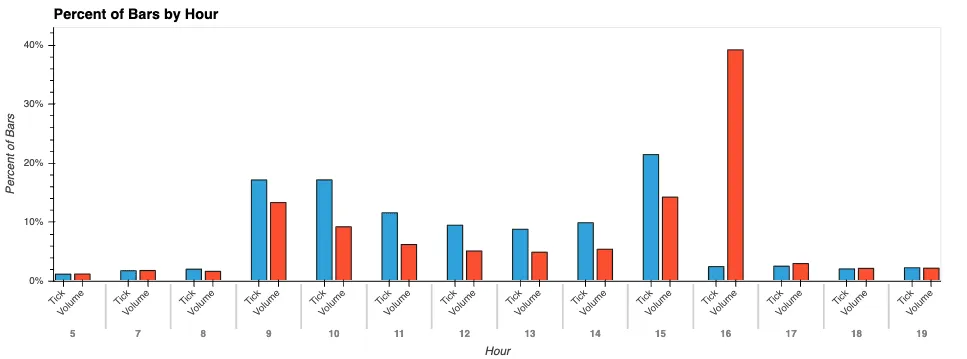
Now, let’s look at how bars are generally distributed throughout the day. For this exercise, we will only look at tick bars and volume bars to make things easy. If you were to include time bars, you would see a constant, and the dollar bars would match the volume bars. When we look at how the bars are distributed throughout the day, we see that tick bars do a much better job of providing information during more active hours than a time-based bar would. However, we know in practice that at close, there is by far the most liquidity during the day. The tick bars show a fairly symmetrical U-shape peaking at open and close. The volume bars, however, show us what we expect to see. A spike at open, and then over 50% of the total daily bars coming in the last 2 hours of the day. This is a stark contrast to the 25% of tick bars that show up over the same period. This should give us more confidence that our dollar and volume bars are providing us with samples that match the underlying flow of information.
You now have 4 different ways to sample bars from trade data, along with an overview of some of the strengths and weaknesses of each. If you want to check out the source code for these functions, you can find it all here. And if you would like to reproduce the analysis done in these articles, the code is available here as a Marimo Notebook without the data. You can get the data to reproduce these analyses from your Databento account.