Get daily closing prices for equities
Official consolidated end-of-day summary data for all US equities is published by the Nasdaq NLS+ feed. This data is normalized into our Databento US Equities Summary dataset.
Overview
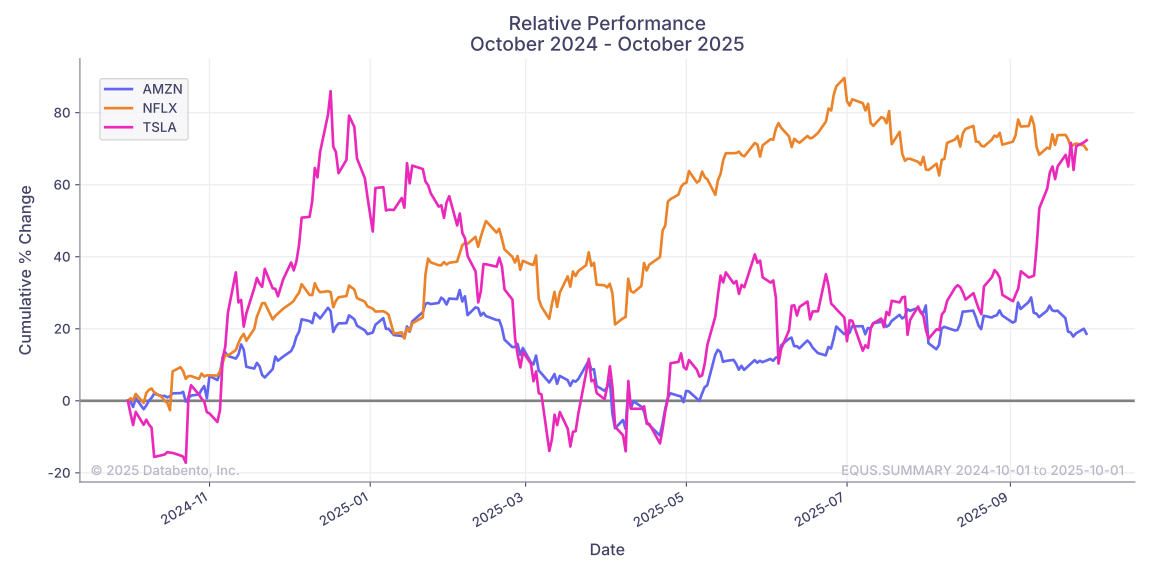
We'll use the historical client to request daily data for multiple equity symbols. For this example, we'll look at a few popular companies like AMZN, NFLX, and TSLA. We'll calculate the cumulative percent change for these symbols over time, then plot the data to compare their relative performance.
Example
1
2
3
4
5
6
7
8
9
10
11
12
13
14
15
16
17
18
19
20
21
22
23
24
25
26
27
28
29
30
31
32
33
34
35
36
37
38
39
40
import databento as db
import matplotlib.pyplot as plt

# Set parameters
dataset = "EQUS.SUMMARY"
symbols = ["AMZN", "NFLX", "TSLA"]
start = "2024-10-01"
end = "2025-10-01"

client = db.Historical("$YOUR_API_KEY")

# Request OHLCV-1d data for the selected symbols
df = client.timeseries.get_range(
    dataset=dataset,
    symbols=symbols,
    schema="ohlcv-1d",
    start=start,
    end=end,
).to_df()

# Calculate cumulative percent change over the request range
df["cum_pct_change"] = df.groupby("symbol")["close"].transform(
    lambda x: (x - x.iloc[0]) / x.iloc[0] * 100,
)

print(df)

# Plot the relative performance of these symbols
df.groupby("symbol")["cum_pct_change"].plot(
    figsize=(12, 6),
    legend=True,
    xlabel="Date",
    ylabel="Cumulative % Change",
    title="Relative Performance\nOctober 2024 - October 2025",
)

plt.axhline(y=0, color="grey", linestyle="-", zorder=1)
plt.grid(True)
plt.tight_layout()
plt.show()
Results
1
2
3
4
5
6
7
8
9
10
11
12
13
14
15
                           rtype  publisher_id  instrument_id     open       high        low    close    volume symbol  cum_pct_change
ts_event
2024-10-01 00:00:00+00:00     35            90            853   184.90   186.1900   183.4519   185.13  36044906   AMZN        0.000000
2024-10-01 00:00:00+00:00     35            90          11275   713.64   717.7600   698.5900   706.13   2813482   NFLX        0.000000
2024-10-01 00:00:00+00:00     35            90          16244   262.67   263.9800   248.5300   258.02  87397613   TSLA        0.000000
2024-10-02 00:00:00+00:00     35            90          16244   247.55   251.1585   241.5000   249.02  93983930   TSLA       -3.488102
2024-10-02 00:00:00+00:00     35            90            853   184.44   186.6000   184.0400   184.76  23704056   AMZN       -0.199860
...                          ...           ...            ...      ...        ...        ...      ...       ...    ...             ...
2025-09-29 00:00:00+00:00     35            90          16244   444.35   450.9800   439.5000   443.21  79491510   TSLA       71.773506
2025-09-29 00:00:00+00:00     35            90            853   220.08   222.6000   219.3000   222.17  44259177   AMZN       20.007562
2025-09-30 00:00:00+00:00     35            90            853   222.03   222.2400   217.8900   219.57  48396369   AMZN       18.603144
2025-09-30 00:00:00+00:00     35            90          11275  1206.41  1208.5000  1178.0000  1198.92   3830304   NFLX       69.787433
2025-09-30 00:00:00+00:00     35            90          16244   441.52   445.0000   433.1200   444.72  74357960   TSLA       72.358732

[750 rows x 10 columns]
See also
The prices seen in the EQUS.SUMMARY dataset are unadjusted for any splits or dividends. This data can be enriched with our corporate actions and adjustment factors datasets.