Get end of day option spreads
Overview
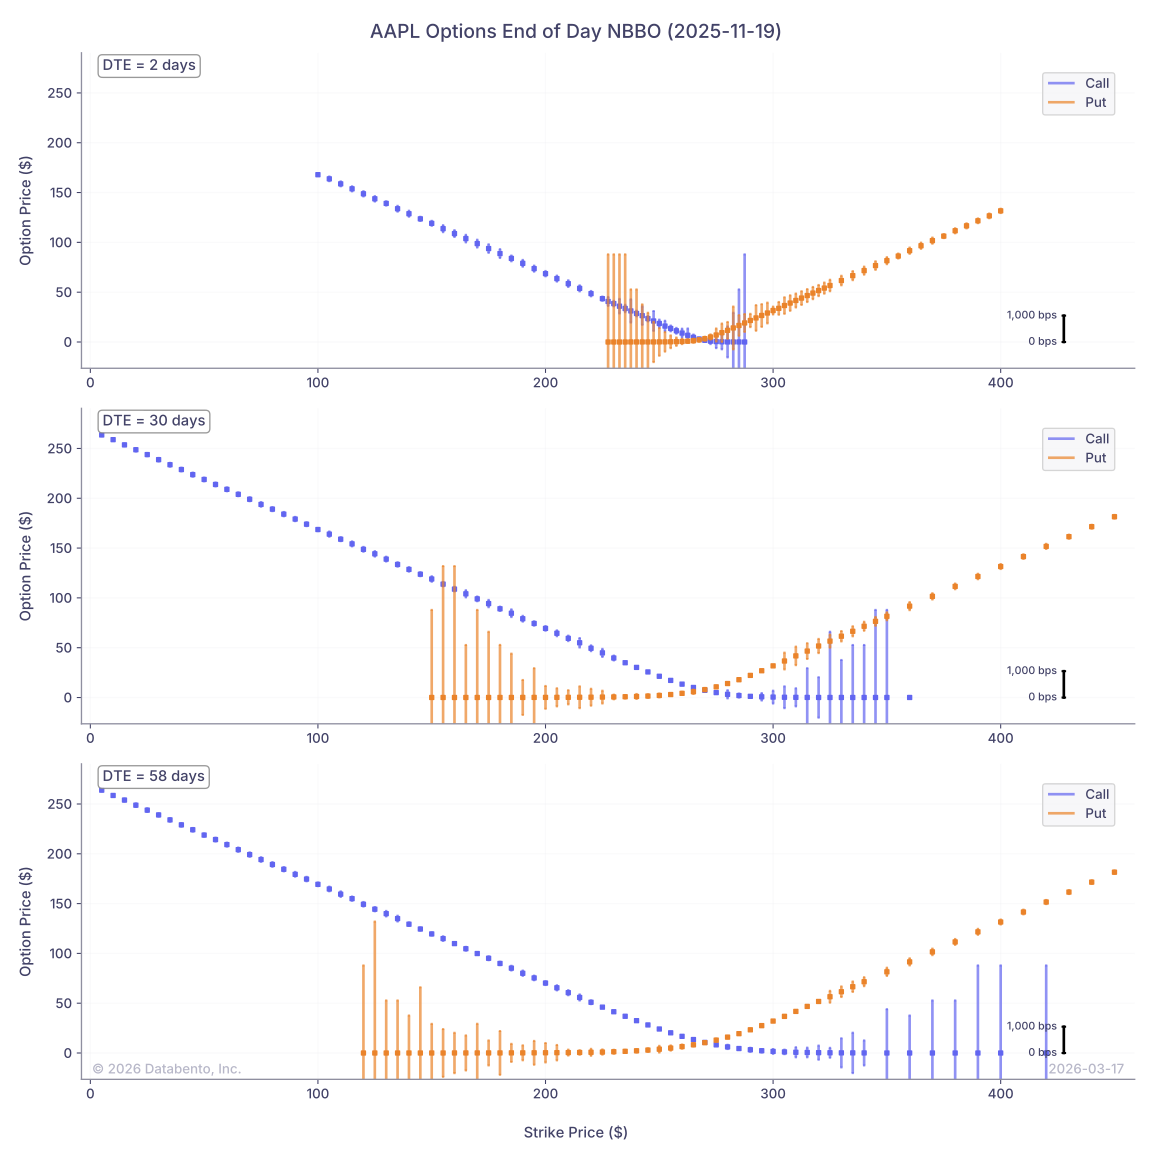
In this example, we'll use the Historical client to get the end of day spread for an options chain.
First, we'll use the definition schema, which contains instrument definitions and properties, to get information such as expiration, strike_price, and instrument_class. We'll also use the CBBO-1m schema to get the bid/ask spread for each option.
We'll plot the end-of-day midprice and spread in basis-points (BPS) across all strikes for multiple expirations.
Example
1
2
3
4
5
6
7
8
9
10
11
12
13
14
15
16
17
18
19
20
21
22
23
24
25
26
27
28
29
30
31
32
33
34
35
36
37
38
39
40
41
42
43
44
45
46
47
48
49
50
51
52
53
54
55
56
57
58
59
60
61
62
63
64
65
66
67
68
69
70
71
72
73
74
75
76
77
78
79
80
81
82
83
84
85
86
87
88
89
90
91
92
93
94
95
96
97
98
99
100
101
102
103
104
105
106
107
108
109
110
111
112
113
114
115
116
117
118
119
120
121
122
123
124
125
126
127
128
129
130
131
132
133
134
135
136
137
138
139
140
141
142
143
144
145
146
147
148
149
150
151
152
153
154
155
156
157
158
159
160
161
162
163
164
165
166
167
168
169
170
171
172
173
174
175
176
177
178
import datetime as dt
from zoneinfo import ZoneInfo
import databento as db
import matplotlib.pyplot as plt
import pandas as pd

def get_options_data(
    client: db.Historical,
    symbol: str,
    schema: str,
    start: dt.datetime,
    end: dt.datetime | None = None,
) -> pd.DataFrame:
    """Fetch options data between timestamps"""
    return client.timeseries.get_range(
        dataset="OPRA.PILLAR",
        schema=schema,
        stype_in="parent",
        symbols=f"{symbol}.OPT",
        start=start,
        end=end,
    ).to_df()


def combine_data(
    trade_date: dt.date,
    df_def: pd.DataFrame,
    df_close: pd.DataFrame,
) -> pd.DataFrame:
    """Combine open and close data with proper column naming"""
    df_close = df_close.groupby("symbol")[["bid_px_00", "ask_px_00"]].last()

    df_def = df_def[["symbol", "instrument_class", "expiration", "strike_price"]]
    df_def["dte"] = (df_def["expiration"].dt.tz_localize(None) - pd.Timestamp(trade_date)).dt.days
    df_def = df_def.set_index("symbol")

    df = df_close.join(df_def, on="symbol", how="left").reset_index().sort_values("symbol")

    # Calculate spreads in basis points
    df["mid_px"] = (df["bid_px_00"] + df["ask_px_00"]) / 2
    df["spread"] = df["ask_px_00"] - df["bid_px_00"]
    df["spread_bps"] = (df["spread"] / df["mid_px"]) / 1e-4

    df["trade_date"] = trade_date

    return df


def plot_spreads(
    symbol: str,
    df: pd.DataFrame,
    target_dtes: tuple[int],
) -> None:
    """Plot bid-ask spreads for selected expirations"""
    fig, axes = plt.subplots(len(target_dtes), 1, figsize=(12, 12))

    selected_expirations = [
        df.loc[(df["dte"] - t).abs().idxmin(), "expiration"] for t in target_dtes
    ]
    subset = df[df["expiration"].isin(selected_expirations)]

    y_min = subset["mid_px"].min()
    y_max = subset["mid_px"].max()
    y_range = y_max - y_min

    x_min = subset["strike_price"].min()
    x_max = subset["strike_price"].max()
    x_padding = (x_max - x_min) * 0.02
    y_padding = y_range * 0.1

    # 10% of y_range = 1000 bps
    y_spread_scale = (y_range * 0.10) / 1000

    for idx, (ax, exp) in enumerate(zip(axes, selected_expirations)):
        df_exp = df[df["expiration"] == exp].copy()

        # Scale spreads for visualization
        df_exp["scaled_spread"] = df_exp["spread_bps"].apply(lambda x: x * y_spread_scale)

        def plot_options(
            instrument_class: db.InstrumentClass,
            color: str,
        ) -> None:
            data = df_exp[df_exp["instrument_class"] == instrument_class].sort_values(
                "strike_price",
            )
            if len(data) > 0:
                half = data["scaled_spread"] / 2

                ax.vlines(
                    x=data["strike_price"],
                    ymin=data["mid_px"] - half,
                    ymax=data["mid_px"] + half,
                    colors=color,
                    linewidth=2,
                    alpha=0.7,
                    label=instrument_class.name.capitalize(),
                )
                for y_offset in (half, -half):
                    ax.hlines(
                        y=data["mid_px"] + y_offset,
                        xmin=data["strike_price"] - 0.5,
                        xmax=data["strike_price"] + 0.5,
                        colors=color,
                        linewidth=1.5,
                        alpha=0.7,
                    )
                ax.plot(data["strike_price"], data["mid_px"], "s", color=color, markersize=3)

        plot_options(db.InstrumentClass.CALL, "C0")
        plot_options(db.InstrumentClass.PUT, "C1")

        ref_x = x_max - (x_max - x_min) * 0.05
        ref_y_base = y_min * 0.3
        s1000 = y_spread_scale * 1000
        ax.plot([ref_x, ref_x], [ref_y_base, ref_y_base + s1000], "k-", linewidth=2)

        for y_off, label in [(0, "0 bps"), (s1000, "1,000 bps")]:
            ax.hlines(
                y=ref_y_base + y_off,
                xmin=ref_x - 1,
                xmax=ref_x + 1,
                colors="black",
                linewidth=1.5,
            )
            ax.text(
                ref_x - 3,
                ref_y_base + y_off,
                label,
                fontsize=8,
                va="center",
                ha="right",
            )

        ax.annotate(
            f"DTE = {df_exp['dte'].iloc[0]} days",
            xy=(0.02, 0.98),
            xycoords="axes fraction",
            fontsize=11,
            ha="left",
            va="top",
            bbox=dict(boxstyle="round,pad=0.3", fc="white", ec="gray", alpha=0.8),
        )

        ax.set_xlim(x_min - x_padding, x_max + x_padding)
        ax.set_ylim(y_min - y_padding, y_max + y_padding)
        ax.set_ylabel("Option Price ($)", fontsize=11)
        ax.grid(True, alpha=0.3)
        ax.legend(loc="upper right")

    fig.suptitle(f"{symbol} Options End of Day NBBO ({df['trade_date'].iloc[0]})")
    fig.supxlabel("Strike Price ($)", fontsize=11)
    plt.tight_layout()
    plt.show()


symbol = "AAPL"
start_date = dt.date(2025, 11, 19)

close_time = dt.time(16, 0, 0, tzinfo=ZoneInfo("US/Eastern"))
close_dt = dt.datetime.combine(start_date, close_time)

client = db.Historical("$YOUR_API_KEY")

df_close = get_options_data(
    client,
    symbol,
    "cbbo-1m",
    close_dt - dt.timedelta(minutes=15),
    close_dt,
)
df_definition = get_options_data(client, symbol, "definition", start_date)

df = combine_data(start_date, df_definition, df_close)
print(df)

# Plot spreads for targeted DTEs
plot_spreads(symbol, df, target_dtes=(0, 30, 60))
Result
1
2
3
4
5
6
7
8
9
10
11
12
13
14
                     symbol  bid_px_00  ask_px_00 instrument_class                expiration  ...  dte   mid_px  spread  spread_bps  trade_date
0     AAPL  251121C00100000     167.30     168.55                C 2025-11-21 00:00:00+00:00  ...    2  167.925    1.25   74.437993  2025-11-19
1     AAPL  251121C00105000     162.30     165.25                C 2025-11-21 00:00:00+00:00  ...    2  163.775    2.95  180.125172  2025-11-19
2     AAPL  251121C00110000     157.25     160.25                C 2025-11-21 00:00:00+00:00  ...    2  158.750    3.00  188.976378  2025-11-19
3     AAPL  251121C00115000     152.25     155.25                C 2025-11-21 00:00:00+00:00  ...    2  153.750    3.00  195.121951  2025-11-19
4     AAPL  251121C00120000     147.25     150.25                C 2025-11-21 00:00:00+00:00  ...    2  148.750    3.00  201.680672  2025-11-19
...                     ...        ...        ...              ...                       ...  ...  ...      ...     ...         ...         ...
2690  AAPL  280121P00490000     219.00     224.00                P 2028-01-21 00:00:00+00:00  ...  793  221.500    5.00  225.733634  2025-11-19
2691  AAPL  280121P00500000     229.00     234.00                P 2028-01-21 00:00:00+00:00  ...  793  231.500    5.00  215.982721  2025-11-19
2692  AAPL  280121P00510000     239.00     244.00                P 2028-01-21 00:00:00+00:00  ...  793  241.500    5.00  207.039337  2025-11-19
2693  AAPL  280121P00520000     249.00     254.00                P 2028-01-21 00:00:00+00:00  ...  793  251.500    5.00  198.807157  2025-11-19
2694  AAPL  280121P00530000     259.00     264.00                P 2028-01-21 00:00:00+00:00  ...  793  261.500    5.00  191.204589  2025-11-19

[2695 rows x 11 columns]