Microprice and book imbalance
In this example, we'll explore different ways to estimate the fair price of a financial instrument using market data. Specifically, we'll examine microprice and book imbalance to better understand order book dynamics.
Overview
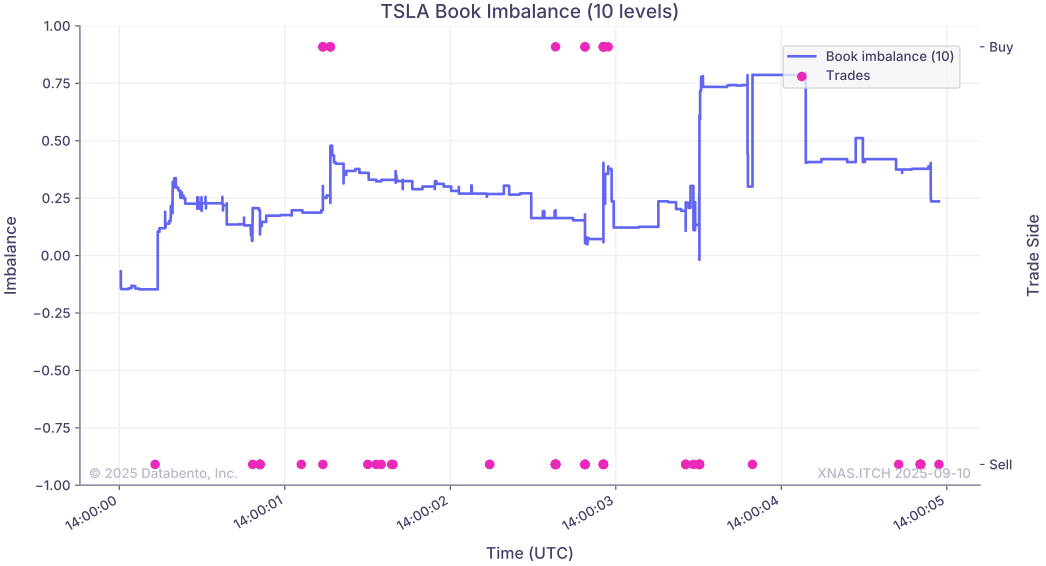
We'll use the MBP-10 schema ("L2" data) which shows all trades, as well as all updates to the top 10 levels of the order book. We'll plot various ways you can use microprice or book imbalance when analyzing price action for an instrument.
The standard formula for microprice, which only uses the top-of-book, is shown below:
where
- and are the best bid and ask prices
- and are the sizes at the best bid and ask price levels
To calculate book imbalance over N levels, we will use the following formula:
where
- is the size at the i-th best bid price level
- is the size at the i-th best ask price level
- is the number of levels to aggregate (e.g., N=5 for top 5 levels)
- ranges from -1 to 1
Example
1
2
3
4
5
6
7
8
9
10
11
12
13
14
15
16
17
18
19
20
21
22
23
24
25
26
27
28
29
30
31
32
33
34
35
36
37
38
39
40
41
42
43
44
45
46
47
48
49
50
51
52
53
54
55
56
57
58
59
60
61
62
63
64
65
66
67
68
69
70
71
72
73
74
75
76
77
78
79
80
81
82
83
84
85
86
87
88
89
90
91
92
93
94
95
96
97
98
99
100
101
102
103
104
105
106
107
108
109
110
111
112
113
114
115
116
117
118
119
120
121
122
123
124
125
126
127
128
129
130
131
132
133
134
135
136
137
138
139
140
141
142
143
144
145
146
147
148
149
150
151
import databento as db
import matplotlib.pyplot as plt
import numpy as np
import pandas as pd

def calc_microprice(
    df_mbp10: pd.DataFrame,
) -> pd.DataFrame:
    """
    Calculate top-of-book microprice.
    """
    numerator = (df_mbp10["bid_sz_00"] * df_mbp10["ask_px_00"]) + (
        df_mbp10["ask_sz_00"] * df_mbp10["bid_px_00"]
    )
    denominator = df_mbp10["bid_sz_00"] + df_mbp10["ask_sz_00"]

    df_mbp10["Microprice"] = numerator / denominator

    return df_mbp10


def calc_book_imbalance(
    df_mbp10: pd.DataFrame,
    n: int,
) -> pd.DataFrame:
    """
    Calculate book imbalance over N levels of the order book.

    If a positive value, there is more size on the bid than the offer.
    If a negative value, there is more size on the offer than the bid.
    If the size is equal, or there is no size on either the bid or the ask, the value will be 0.
    """
    total_bid_size = df_mbp10[[f"bid_sz_{i:02}" for i in range(n)]].sum(axis=1).astype("int64")
    total_ask_size = df_mbp10[[f"ask_sz_{i:02}" for i in range(n)]].sum(axis=1).astype("int64")

    s = ((total_bid_size - total_ask_size) / (total_bid_size + total_ask_size)).fillna(0)
    df_mbp10[f"Book imbalance ({n})"] = s

    return df_mbp10


def plot_microprice(
    df_mbp10: pd.DataFrame,
    symbol: str,
) -> None:
    """
    Plot microprice against midprice and trades.
    """
    df_trades = df_mbp10[df_mbp10["action"] == db.Action.TRADE]

    df_mbp10["Midprice"] = (df_mbp10["bid_px_00"] + df_mbp10["ask_px_00"]) / 2
    df_mbp10 = calc_microprice(df_mbp10)

    y_tick_range = np.arange(
        min(df_mbp10["bid_px_00"].min(), df_trades["price"].min()),
        max(df_mbp10["ask_px_00"].max() + tick_size, df_trades["price"].max() + tick_size),
        tick_size,
    )

    # Plot
    df_mbp10.plot(
        y=["Midprice", "Microprice"],
        title=f"{symbol} Midprice vs. Microprice",
        xlabel="Time (UTC)",
        ylabel="Price",
        drawstyle="steps-post",
    )

    # Plot trades
    plt.scatter(
        df_trades.index,
        df_trades["price"],
        color="C2",
        marker=".",
        s=100,
        label="Trades",
    )

    plt.yticks(y_tick_range)
    plt.legend()
    plt.show()


def plot_book_imbalance(
    df_mbp10: pd.DataFrame,
    symbol: str,
    n: int = 10,
) -> None:
    """
    Plot book imbalance over N levels of the book, along with trades.
    """
    df_trades = df_mbp10[df_mbp10["action"] == db.Action.TRADE]

    df_mbp10 = calc_book_imbalance(df_mbp10, n)

    # Plot
    ax1 = df_mbp10[f"Book imbalance ({n})"].plot(
        drawstyle="steps-post",
        title=f"{symbol} Book Imbalance ({n} {'level' if n == 1 else 'levels'})",
        xlabel="Time (UTC)",
        ylabel="Imbalance",
    )
    ax1.set_ylim(-1, 1)

    # Plot trades
    df_trades["is_buy"] = np.where(df_trades["side"] == "B", 1, -1)
    ax2 = ax1.twinx()
    ax2.scatter(
        df_trades.index,
        df_trades["is_buy"],
        color="C2",
        marker=".",
        s=150,
        label="Trades",
    )

    lines1, labels1 = ax1.get_legend_handles_labels()
    lines2, labels2 = ax2.get_legend_handles_labels()
    ax2.legend(lines1 + lines2, labels1 + labels2)
    ax2.grid(False)
    ax2.set_yticks([-1, 1])
    ax2.set_yticklabels(["Sell", "Buy"])
    ax2.set_ylabel("Trade Side")
    plt.show()


if __name__ == "__main__":
    # Set parameters
    dataset = "XNAS.ITCH"
    symbol = "TSLA"
    tick_size = 0.01
    start = "2025-09-10T14:00:00"
    end = "2025-09-10T14:00:05"

    # Create historical client
    client = db.Historical("$YOUR_API_KEY")

    # Download MBP-10 data and convert to a DataFrame
    mbp10_df = client.timeseries.get_range(
        dataset=dataset,
        symbols=symbol,
        start=start,
        end=end,
        schema="mbp-10",
    ).to_df()

    # Plot top-of-book microprice
    plot_microprice(mbp10_df, symbol)

    # Plot book imbalance with 10 levels of the orderbook
    plot_book_imbalance(mbp10_df, symbol, 10)
Results
First, we'll take a look at the microprice and compare it to the midprice. Microprice will take into account the size on the bid and offer.
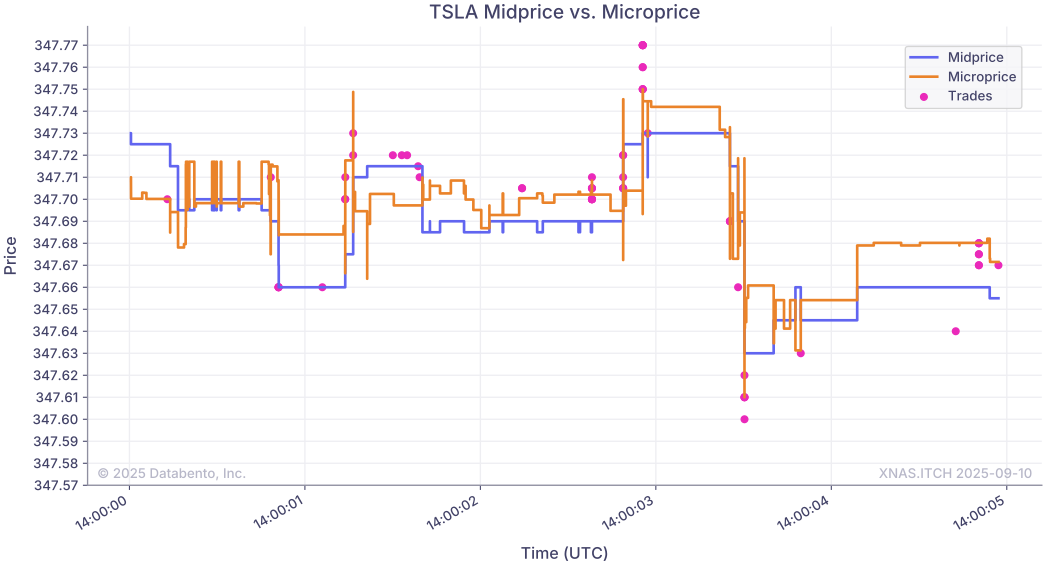
Since microprice is sensitive to changes in the orderbook, it may offer some predictive power for future price movements.
Below, we'll take a look at book imbalance, which is a calculated indicator between -1 and 1. Book imbalance can look at multiple levels of the order book. Positive values mean there is more cumulative size on the bid than the offer, negative values mean there is more cumulative size on the offer, and a zero value means the bid and offer have the same total size.